Treasury Management
This document describes the methodology used to report Hedera's management of the allocated and unallocated supply of HBAR as directed by the Council's Treasury Management and Token Economics Committee and presents the current data as of June 4, 2026.
Classification of HBAR
The Hedera network was launched with a Total Supply of 50 billion HBAR. The Total Supply of HBAR may not be modified without the unanimous consent of the members of the Hedera Council (LLCA § 8.4).
All HBAR are initially considered Unreleased Supply until they are transferred to a User Account, i.e., an account operationally controlled by anyone other than the Hedera Council. For the purposes of this report, there are two types of Unreleased Supply:
- Unallocated Supply has yet to be given a particular purpose by the Hedera Council, and is generally stored in the following Unallocated Supply Accounts:
- 0.0.2,
- 0.0.49, and
- 0.0.400 through 0.0.438.
- Allocated Supply has been the subject of a decision by the Hedera Council to assign a particular purpose to specified amounts of Unallocated Supply, and is generally stored in the following Allocated Supply Accounts:
- 0.0.42 through 0.0.48,
- 0.0.50 through 0.0.71,
- 0.0.73 through 0.0.87,
- 0.0.99 through 0.0.102,
- 0.0.111,
- 0.0.112, and
- 0.0.439 through 0.0.499.
Unreleased Supply transferred to a User Account is reclassified as Released Supply as of the time of transfer. Hedera does not use or define the term Circulating Supply. Released Supply may be considered one possible method of determining Circulating Supply; however, different external parties may apply different definitions to certain HBAR.
* For more information on released supply, please see: What is Hedera's circulating supply of HBAR?
Allocations
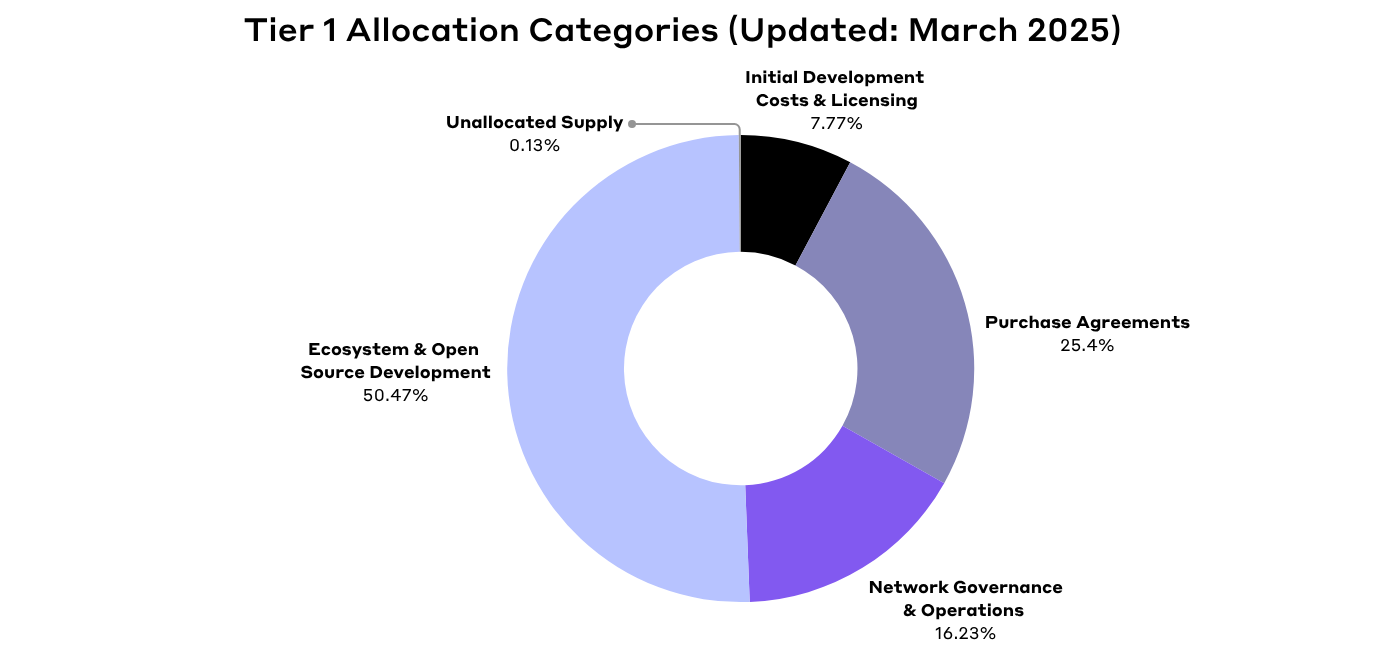
Hedera reports new and existing allocations of Unallocated Supply into Allocated Supply as soon as practicable after the allocation becomes effective, but no less than quarterly. Related allocations are pooled into allocation categories and reported in the following chart with descriptions for each pool. Allocation amounts are not reduced after the related Allocated Supply is released and always sum to the Total Supply.
The new charts below reflect the December 2024 allocations, as documented in Will the Hedera Council provide an additional grant to the Hedera Foundation in connection with the previously announced leadership changes? – Hedera Help, as well as the allocations noted below:
| Allocation Category | 2025 | % |
|---|---|---|
| Initial Development Costs and Licensing | 3,882,948,559 | 7.77% |
| Purchase Agreements | 12,698,348,449 | 25.40%* |
| Network Governance and Operations | 8,116,201,648 | 16.23%** |
| Ecosystem and Open Source Development | 25,302,501,344 | 50.61%*** |
| Sub-total Allocated | 50,000,000,000 | 100% |
| Unallocated Supply | 0 | 0% |
| TOTAL | 50,000,000,000 | 100% |
- * Adjusted based on actual and forecasted price of HBAR at time of distribution.
- ** Now includes 780M HBAR allocated (but not distributed) for board reserves.
- *** Includes new ecosystem grants.
Initial Development Costs and Licensing
Initial Development Costs and Licensing includes all HBAR allocated to license and deploy the hashgraph technology, which was originally engineered and patented by Swirlds, Inc. The Hashgraph License Agreement required ongoing monthly payments to Swirlds, Inc. for use of the technology on a public ledger. Payment to Swirlds' investors was a one-time compensation for their commitment of Swirlds resources and personnel to the Hedera deployment. All intellectual property was purchased and the process of open-sourcing it began in 2022, which ended the need to continue allocating coins into this category.
Purchase Agreements
Purchase Agreements include all HBAR sold to users under regulated sales contracts. Simple Agreements for Future Tokens (SAFTs), regulated investment contracts under applicable securities laws, were sold prior to network functionality. The SAFT Exchange Offer offered initial SAFT purchasers the opportunity to receive additional HBAR in exchange for a longer release schedule. Token Purchase Agreements (TPAs), regulated swap contracts under applicable commodities laws, were sold after network functionality to support ongoing operations.
Network Governance and Operations
Network Governance and Operations includes all HBAR used as compensation to founders, executives, employees, and contractors. The Coin Plan was the initial structure for compensation to contributors in fixed amounts of HBAR. Council Operations reflects the current structure of compensation to contributors and is largely tailored to measurable governance or operational contributions.
Ecosystem and Open Source Development
Ecosystem and Open Source Development includes all HBAR released to the community for furthering the decentralization and development of the Hedera ecosystem. The Community Incentive Program and Developer grants were early programs designed to incentivize testing of the Hedera network and jumpstart development of essential applications. The Ecosystem Development Program is a commitment by the Hedera Council to significantly empower independent organizations such as the Hedera Foundation and take other actions that further decentralize ecosystem growth efforts.
Unallocated Supply
Unallocated Supply includes the remaining HBAR yet to be given a particular purpose by the Hedera Council.
Release Schedule
The following tables report the actual release of HBAR (shown in kilobars (thousands of HBAR)) under each allocation category by calendar quarter showing forecasted releases through the following quarter based on existing commitments to counterparties. Estimated releases beyond one quarter may introduce inaccuracies and reduce the integrity of this report.
| Allocation Categories (Tier 1 & 2) | Open Access (Actl) | 2019 (Actl) | Q1 2020 (Actl) | Q2 2020 (Actl) | Q3 2020 (Actl) | Q4 2020 (Actl) | Q1 2021 (Actl) | Q2 2021 (Actl) | Q3 2021 (Actl) | Q4 2021 (Actl) | Q1 2022 (Actl) | Q2 2022 (Actl) | Q3 2022 (Actl) | Q4 2022 (Actl) | Q1 2023 (Actl) | Q2 2023 (Actl) | Q3 2023 (Actl) | Q4 2023 (Actl) | Q1 2024 (Actl) | Q2 2024 (Actl) | Q3 2024 (Actl) | Q4 2024 (Actl) | Q1 2025 (Actl) | Q2 2025 (Actl) | Q3 2025 (Actl) | Q4 2025 (Actl) | Q1 2026 (Actl) | Q2 2026 (Actl/Fcst) |
|---|---|---|---|---|---|---|---|---|---|---|---|---|---|---|---|---|---|---|---|---|---|---|---|---|---|---|---|---|
| Initial Dev Costs/Licensing (Tier 1) | 3,510,714 | - | - | - | - | 293,465 | 32,719 | 7,395 | 9,150 | 5,037 | 4,577 | - | - | - | - | - | 10,723 | - | - | - | - | - | 9,168 | - | - | - | - | - |
| Hashgraph License Agreement (Tier 2) | 2,500,000 | - | - | - | - | 293,465 | 32,719 | 7,395 | 9,150 | 5,037 | 4,577 | - | - | - | - | 10,723 | - | - | - | - | - | - | - | - | - | - | - | - |
| Swirlds (Tier 2) | 1,010,714 | - | - | - | - | - | - | - | - | - | - | - | - | - | - | - | - | - | - | - | - | - | - | - | - | - | - | - |
| Purchase Agreements (Tier 1) | 378,606 | 916,050 | 714,393 | 614,545 | 1,292,931 | 643,504 | 547,496 | 519,896 | 982,621 | 609,837 | 526,931 | 523,885 | 723,723 | 531,441 | 561,178 | 531,799 | 424,981 | 50,588 | 37,969 | 28,132 | 67,513 | 33,760 | 145,957 | 10,338 | 48 | 410 | 184 | 130 |
| SAFT Fundraising (Tier 2) | 378,606 | 916,050 | 714,393 | 614,545 | 562,931 | 502,951 | 502,780 | 515,775 | 543,692 | 504,389 | 506,869 | 502,643 | 541,458 | 333,148 | 331,676 | 332,438 | 340,747 | 3,668 | 4,010 | 3,741 | 38,213 | - | - | - | - | - | 6 | - |
| SAFT Exchange Offer (Tier 2) | - | - | - | - | - | 140,553 | 44,715 | 4,121 | 1,279 | 54,532 | 20,063 | 720 | 39,537 | 20,995 | 30,658 | 22,355 | 29,773 | 29,023 | 33,959 | 24,391 | 29,300 | 33,760 | 145,957 | 155 | 48 | 410 | 177 | 130 |
| TPA Sales (Tier 2) | - | - | - | - | 730,000 | - | - | - | 437,650 | 50,916 | - | 20,522 | 142,728 | 177,298 | 198,844 | 177,006 | 54,461 | 17,897 | - | - | - | - | 10,183 | - | - | - | - | - |
| Network Governance/Ops (Tier 1) | - | 640,865 | 892,140 | 178,332 | 272,715 | 410,996 | 396,121 | 515,224 | 576,252 | 555,716 | 368,090 | 321,211 | 329,055 | 297,432 | 344,900 | 392,868 | 329,226 | 93,943 | 46,263 | 17,330 | 100,079 | 187,670 | 312,739 | 149,596 | 12,920 | 383,372 | 317,789 | 170,971 |
| 2018 Coin Plan (as amended) (Tier 2) | - | 640,865 | 761,930 | 145,539 | 238,633 | 375,966 | 368,237 | 493,386 | 554,413 | 535,014 | 359,720 | 313,855 | 320,389 | 289,168 | 311,029 | 363,940 | 308,949 | 72,983 | 31,420 | 14,059 | 20,465 | 38,861 | 7,982 | 8,625 | 11,638 | 12,605 | 16,590 | 18,586 |
| Council Operations* (Tier 2) | - | - | 130,209 | 32,793 | 34,082 | 35,031 | 27,884 | 21,838 | 21,839 | 20,703 | 8,370 | 7,356 | 8,666 | 8,265 | 33,871 | 28,929 | 20,277 | 20,960 | 14,843 | 3,271 | 79,613 | 148,810 | 304,757 | 140,971 | 1,281 | 370,767 | 301,199 | 152,385** |
| Ecosystem/Open Source Dev (Tier 1) | - | 8,106 | 10,863 | 22,877 | 50,595 | 51,950 | 37,077 | 11,042 | 113,280 | 2,548,021 | 495,917 | 707,310 | 1,915,035 | 18,426 | 4,468,186 | 799,962 | 449,019 | 33,731 | 15,588 | 1,996,090 | 1,697,796 | 404,273 | 3,500,000 | - | - | - | 208,765 | 3,800,000 |
| Community Incentive Program/Dev Grants (Tier 2) | - | 8,106 | 10,863 | 22,877 | 50,595 | 51,950 | 37,077 | 11,042 | 113,280 | 6,691 | 22,222 | 13,365 | - | 5,616 | - | - | - | - | - | - | - | - | - | - | - | - | - | - |
| Ecosystem Dev Program* (Tier 2) | - | - | - | - | - | - | - | - | - | 2,541,330 | 473,695 | 401,263 | 995,094 | 12,735 | 654,073 | 799,962 | 449,019 | 33,731 | 15,588 | 1,996,090 | 1,697,796 | 404,273 | 3,500,000 | - | - | - | 208,765 | 3,800,000 |
| Open Source Dev (Tier 2) | - | - | - | - | - | - | - | - | - | - | - | 292,683 | 919,941 | 75 | 3,814,113 | - | - | - | - | - | - | - | - | - | - | - | - | - |
| Sub-total Allocated (Tier 2) | 3,889,320 | 1,565,021 | 1,617,396 | 815,754 | 1,616,240 | 1,399,915 | 1,013,413 | 1,053,557 | 1,681,304 | 3,718,612 | 1,395,516 | 1,552,406 | 2,967,814 | 847,299 | 5,374,264 | 1,724,629 | 1,213,950 | 178,262 | 99,820 | 2,041,551 | 1,865,388 | 625,703 | 3,967,864 | 159,934 | 12,968 | 383,782 | 526,737 | 3,971,101 |
| Unallocated Supply (Tier 1) | ||||||||||||||||||||||||||||
| Released Supply (Tier 2) | 3,889,320 | 5,454,341 | 7,071,737 | 7,887,491 | 9,503,731 | 10,903,647 | 11,917,059 | 12,970,616 | 14,651,920 | 18,370,532 | 19,766,047 | 21,318,454 | 24,286,268 | 25,133,567 | 30,507,831 | 32,232,460 | 33,446,410 | 33,624,672 | 33,724,492 | 35,766,043 | 37,631,431 | 38,257,134 | 42,224,999 | 42,384,932 | 42,397,900 | 42,781,682 | 43,308,419 | 47,279,521 |
| Aggregate Percentage (Tier 2) | 7.78% | 10.91% | 14.14% | 15.77% | 19.01% | 21.81% | 23.83% | 25.94% | 29.30% | 36.74% | 39.53% | 42.64% | 48.57% | 50.27% | 61.02% | 64.46% | 66.89% | 67.25% | 67.45% | 71.53% | 75.26% | 76.51% | 84.45% | 84.77% | 84.80% | 85.56% | 86.62% | 94.56% |
| Illiquid Supply (Tier 2) | - | - | - | - | - | - | - | - | - | - | - | - | - | - | 2,672,939 | 2,477,710 | 2,331,206 | 2,213,307 | 145,883 | 36,471 | - | - | - | - | - | - | - | - |
| Adjusted Released Supply (Tier 2) | - | - | - | - | - | - | - | - | - | - | - | - | - | - | 27,834,892 | 29,754,751 | 31,115,204 | 31,411,365 | 33,578,608 | 35,729,572 | 37,631,431 | 38,257,134 | 42,224,999 | 42,384,932 | 42,397,900 | 42,781,682 | 43,308,419 | 47,279,521 |
| Adjusted Aggregate Percentage (Tier 2) | - | - | - | - | - | - | - | - | - | - | - | - | - | - | 55.67% | 59.51% | 62.23% | 62.82% | 67.16% | 71.46% | 75.26% | 76.51% | 84.45% | 84.77% | 84.80% | 85.56% | 86.62% | 94.56% |
Comments:
- * Includes variable commitments based on USD.
- ** Includes approximately 150M HBAR for operating reserves.
Notes
For the purposes of the above reports, the following principles are applied:
Projections
If an allocation or future commitment is priced in a currency other than HBAR, actual release amounts may vary from the amounts in this report. Such allocation categories and/or future commitments are projected through the end of the current calendar year using best available fair market value at the time the report is created.
Precision
Any annual and quarterly numbers are rounded to the nearest 1,000 HBAR. Rounding, fees, and minor release errors may skew the numbers below this amount.
Disclaimer and Amendments
Statements in this report relating to Hedera's future plans, expectations, beliefs, intentions and prospects, including statements regarding its current and future operating expenses and any financial projections, are "forward-looking statements" and are subject to material risks and uncertainties. While they are all made in good faith, no assurance can be made that any or all of the events in such forward-looking statements will occur, and you should not place undue reliance upon them. Hedera makes no representation or warranty, express or implied, with respect to any financial projection or forecast relating to Hedera, the Hedera network, HBAR, or with respect to the accuracy of any underlying assumption. Any external party is fully responsible for making its own evaluation of the adequacy, reliability, and accuracy of any projections or forecasts furnished to it. All data contained herein is presented on a good faith basis and is subject to further audits, updates, and corrections if required.